Trusted data for smarter water and environmental decisions.
Welcome to WISKI. The Water Information System from KISTERS.
Our all-in-one software system that integrates, cleans, validates, and harmonises environmental data
- empowering utilities and agencies to operate efficiently and confidently.

Introducing WISKI - The data foundation everyone trusts.
Whether you manage hydrometric networks, water quality, weather forecasting, or urban water systems, WISKI helps get the data right- turning complex, scattered data into clear, actionable insights – so you get the right answers faster.
Good data, guaranteed. Accurate, consistent environmental data to power operational excellence. Trusted by hundreds of water utilities, agencies, and consultants tackling complex monitoring challenges worldwide. From small networks to entire regions, WISKI adapts as you grow.
Why choose WISKI?
- Automatically cleans and validates diverse data sources
- Trusted by hundreds of water utilities, agencies, and consultants worldwide
- Secure, unlimited storage
- Full team collaboration
- Automated quality control
- Data-editing tools
- Simplify reporting and stay audit-ready
- Connects easily with sensors, SCADA, and other platforms
- Add-ons & customisation options
- Access your data on-premise or via the web
- 24/7 access to expert support

WISKI can help harmonise data from...
- Hydrological measurements
- Groundwater analysis
- Biodiversity sampling
- Meteorological measurement
- Flooding and disaster management
- Fire weather
- Pest management
Configured to your needs
Our full range of WISKI extensions offer specific solutions to meet your needs and preferences. Arrange a consultation and we’ll identify a tailored solution for your organization.
Discuss your needs
WISKI extensions
Increase data confidence
with WISKI Validation

Increase data confidence
Automate the verification, validation, and correction time-series data with WISKI Validation.
Then prepare scheduled or ad hoc reports from one single source of truth supports decisions and actions.
Why choose WISKI Validation?
Data validation
An intuitive web interface lets users easily check and standardize data.
Change reports
Audit any and all edits to wide variety of measurements & parameters over long periods of time.
Custom rules
Select algorithms from a default library, or use python to write more complex, customized scripts.
Automation
Warning messages and custom validation rules mean less input errors and more accurate data.
Data visualization
Easily view, compare and confirm observations and trends. Color-coding prioritizes tasks that need attention.
Want to learn more?
Book your demoDigitize paper field notes
with FieldVisits

Digitize paper field notes
Data QA/QC begins in the field with digital field notes. Leave behind time-consuming, error-prone manual processes.
With KISTERS FieldVisits, field staff can accurately capture all site-relevant data, even in remote areas without Wi-Fi.
The mobile app can display previous observations, notes and manuals, confirming that new measurements are reasonable.
Why choose WISKI FieldVisits?
Streamline processes
The user-friendly app easily records & standardizes data, replacing notebooks and field sheets. No need to transpose.
Increase data accuracy
Warning messages and custom data validation rules result in fewer errors and more accurate data.
Enhance monitoring records
Capture photos and videos. Add comments. Enrich observations with detail and site-specific insights.
Provide in-field guidance
Easily view & compare historical trends, confirm new observations, or access manuals to resolve problems in the field.
Broadly applicable
Use FieldVisits to measure a wide variety of parameters, continuous or point in time.
Want to learn more?
Book your demoSupercharge your data and add extra intelligence
with KISTERS Analytics

Supercharge your data and add extra intelligence
Keep WISKI. Add KISTERS Analytics.
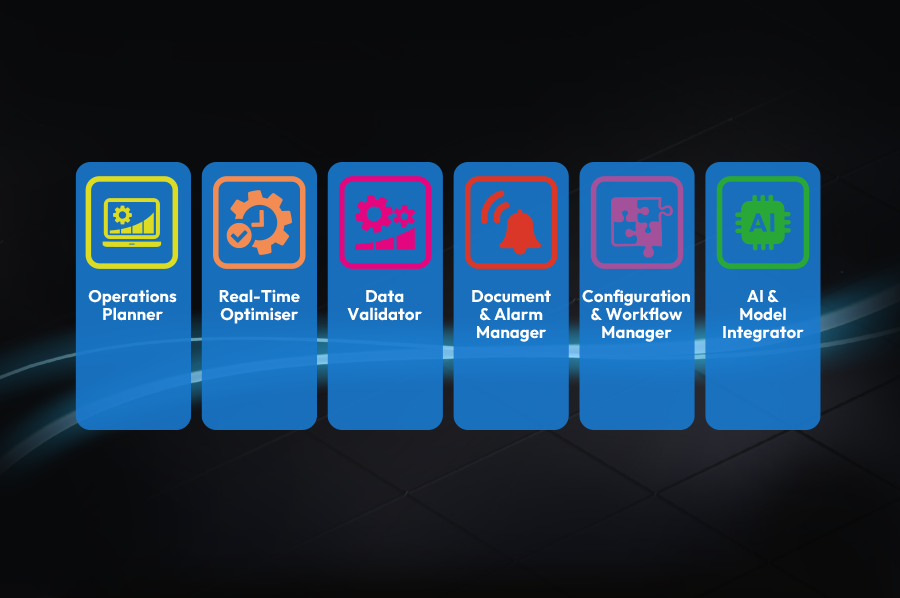
You already collect the data you need – turning it into decisions is the hard part. KISTERS Analytics sits on top of WISKI as an intelligence layer, connecting advanced automation, data validation and predictive insight tools in one flexible platform so your team can act in real time – with no disruption to current workflows.
Why add KISTERS Analytics to WISKI?
- Works with what you have – seamless integration with WISKI data and workflows you already trust
- Automates the manual grind – schedule model runs, validation and reporting to free up time
- Predictive and proactive – AI, predictive modelling and Digital Twins to forecast risks and recommend actions
- Modular and flexible – add specialised modules as you need them (AI & Model Integration, Real-Time Optimisation, Data Validation, Operations Planning, Configuration and Workflow Management, Document and Alarm Management )
- Built with industry expertise – proven methods, growing catalogue of models and global support
From data to decisions – without replacing WISKI.
Harmonize continuous & discrete data
with KiWQM & KiECO

Harmonize continuous & discrete data
In nature, interactions abound. Rain impacts water quality, and runoff affects soil health.
Apply WISKI’s advanced automation, quality control and data visualization to discrete monitoring data.
The KiWQM water quality module and KiECO ecological data module help understand environmental flow.
Study the impacts of wildlfire on water quality. Identify flow regimes that protect ecological integrity. What complex relationships do you analyze?
Why choose WISKI KiWQM and KiECO?
Watershed analysis
Develop a holistic understanding of your watershed with a consolidated environmental data management system.
QA/QC automation
Automate data validation with plausibility checks, quality codes, legal threshold definitions. Verify lab EDDs against orders, and more.
User-defined flexibility
Approved-users can proactively update and trace methodologies, properties and codes without waiting for administrator permissions.
QAPP compliance
Site visit scheduling tools, extensive metadata storage and internal links help meet Quality Assurance Project Plan compliance.
Customized solutions
Customize KiWQM & KiECO features to your preferences. Standardize report template formatting. Calculate specific biotic indices.
Want to learn more?
Book your demoPerform hydrologic operations
with BIBER & SKED

Perform hydrologic operations
We are an IT company, but hydrology expertise and hydrologic applications have set us apart from the beginning.
Embedded in WISKI are the BIBER discharge measurement module and the SKED rating curve editor.
Compatible with all conventional Acoustic Doppler Current Profiler (ADCP) and streamflow measuring devices from major suppliers, these modules support automated calculations and stage-discharge rating curve management.
Generate solutions and workflows for natural flow and standard cross-sections, shift curves, and 3-point stage shifts which comply with USGS methods.
Why choose WISKI?
Data accuracy
Verify data using confidence intervals & statistical plausibility checks. Blend intervals for rating curve segments, or exclude measurements from regressions.
Extensive flexibility
Define cross-sections. Edit every recorded measurements if desired. Convert simple or complex regressions into standard cross-sections.
Data visualization
Easily view the most complex cross-sections. Combine wet & dry profiles into a single composite. Readily see dates of validity and comments. Preloaded functions support advanced fit analysis. Click & drag points, or use windows to enter precise values.
Advanced rating curve features
Create stage-discharge curves using hysteresis or other complex methods. Construct elevation-storage curves for lakes/reservoirs. Supplement sparse measurement data with constructed/estimated points.
Track & calibrate sensors
Track sensors, current meters, impulse converters, and calibration equations. Configure and manage sensors from any manufacturer.
Want to learn more?
Book your demoCalculate fire weather analytics
with KiFX

Calculate fire weather analytics
Apply advanced analytics in WISKI to fire weather data you collect with the KiFX module.
Proactive, integrated planning and data sharing reduce the risks of drought and flooding. Measuring weather and water resources, above and below ground, prepares water managers for drought. Real-time calculations and automated alerts keep you aware of developing conditions.
Fire weather forecasts can also inform water storage and release like storm forecasts.
Streamline the full flow of your environmental data and review maximum insights before emergencies emerge.
Why choose WISKI?
An all-in-one solution
Centralize data management with a robust core framework, automation controls, and flexible connections to multiple fire weather models. Do more with the data: drive decisions.
Extensive automation
Recover and reallocate time from time-consuming data processing. Automatically import data from stations, approved partners, and more sources. Select QA/QC rules or calculations from a library, or write your own.
Data visualization flexibility
Information stored in or calculated by WISKI are accessible by the variety of your approved stakeholders. APIs and web solutions present information online, within a GIS, or via map outputs.
Data access control
Restrict or share access to sensitive information with authorized users. Alternatively, specify information fit for the press and public.
Open to your enhancement
Fully customize your solution from data sources to online publishing.
Want to learn more?
Book your demoIntegrate with GIS systems
with WISKI arc extensions or APIs

Integrate with GIS systems
Integrate geo-referenced data with time series data to better visualize, analyze and understand trends.
Explore problems and progress at a particular site, group of sites, basin or broader area.
The Field Sample Management solution is one example of joint esri & KISTERS IT optimizing value from your data.
Why choose WISKI arc extensions?
Support spatial analysis
WISKI Arc extensions, or WISKI APIs for other GIS platforms, provide easy access to information in WISKI. Analysts can readily query, inspect and share insights using extensive GIS functions.
Map data without coordinates
Digitize & adapt monitoring site coordinates based on available background maps even if measured coordinate information is unavailable.
Enhance reporting & publications
Create static or animated maps for reports, websites and presentations. Also configure ArcGIS Dashboards to convey information in a single screen.
Expand data visualization options
ArcGIS Javascript API powers high-quality mapping within the WISKI Web interface, engaging web visitors with time-aware data.
Safely share data online
with WISKI Web

Safely share data online
Responsive, intuitive, and customized web portals allow you to effortlessly publish approved environmental data online.
Options to access, filter, visualize and download critical information empower your team to make decisions that drive meaningful change.
Why choose WISKI Web?
Responsive design
The web portal adapts to the wide array of devices and screen sizes used by your website visitors.
Easy navigation
Make your data discoverable and engaging. Visitors will be familiar with dropdown menus, sliders, and dynamic maps to find information meaningful to them.
Flexible APIs & web services
Choose from one-way open data publishing, two-way read/write data service, and real-time data verification. Eliminate time-consuming data requests with scheduled or real-time publishing of frequently asked information.
Open data standards compliance
Our web services support many file formats and industry-approved open data standards. Reallocate time spent converting data.
Tailored solution
Configuration options abound for the appearance as well as the integration with other IT or operational systems.
Want to learn more?
Learn more about WISKI
FAQs
How does WISKI work?
WISKI is an all-in-one water, weather and environmental data management system that allows you to efficiently monitor networks, parameters and time-series data. It imports, archives, validates and analyzes data. In addition, it prepares clear, sharable reports, tables, graphs and observations. Get comprehensive insight into your monitoring data like never before.
Whom is WISKI for?
WISKI is designed to simplify data monitoring across a huge range of fields: hydrology (surface and groundwater), meteorology, flood forecasting, water quality, stormwater management and water pollution control, urban water systems, reservoir operations and hydropower generation.
Our global customer base ranges from federal and state / provincial environmental agencies to local municipalities and watershed districts, from metropolitan utilities to small engineering firms, mining companies – and more are joining us every year.
How does WISKI improve decision support?
Imagine if you can transform vast amounts of diverse, disorganized datasets into information your entire team can access, analyze, and understand. That’s the power of WISKI. You can trust your data and have confidence to take effective, decisive action – from the field to the boardroom, and into the community.
Also consider KISTERS Decision Support System, web-based software that maximizes value from your data by linking it to operational forecast models.
How can WISKI meet my needs?
From single users to large enterprises, WISKI flexibly scales to data and tools are available and appropriate to each user, including user interface and language requirements. Deploy the system on-premise servers, in the cloud, or hybrid environments. Use WISKI or extend its functionality with modules. In fact, options to customize WISKI are endless. It’s designed to grow with as the needs of your organization change.
How can WISKI save me time?
WISKI reduces your manual workload. Custom automation options streamline many data processing tasks. So you can focus on more critical tasks, and address alerts when they arise. With secure, unlimited storage capacity, you can quickly access multidisciplinary data, dive into understanding it, and share findings with collaborators, decision-makers or the public.


